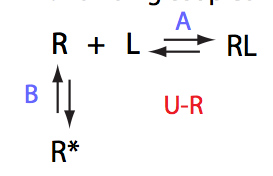
In this model an intramolecular isomerization occurs in the receptor molecule. Only one of the two isomers is capable to appreciably bind the ligand. This is a mechanism based on pre-existing conformational equilibrum.
This is the simplest example. All species are in slow exchange, we will see three peaks. I set up simulation for the slow isomerization process with 3:1 ratio in favor of R* and micromolar binding with slow off-rate.
We will add it to Example 1 folder by using setup.txt.
Report summary_report.htm


All peaks stay put due to definite slow-exchange regime. The minor peak, corresponding to the binding-competent R is small and disappears well before equivalence point is reached.
Isomerization process will have the same 3:1 ratio in favor of R* and micromolar binding with fast off-rate: U_R_Af_Bs.txt, setup.txt.
Report: summary_report.
Simulate
One of the most significant features of this model is that population of the free receptor is always split between R (black symbols) and R* (red symbols) with the same ratio given by the equilibrium constant KB :

It can be demostrated that the apparent binding affinity of L to R is KA reduced by the magnitude of KB.
Spectra for this case have a signature pattern that the major peak (R*) gradually loses intensity as titration progresses with the line width remaning constant. The R peak, initially barely visible and very broad, gives rise to a narrowing fast exchange peak as RL accumulates, shifting from the position of R to RL.


NOTE: This behavior is very similar to U_R2 model !!! Use ITC profile to tell them apart.
Another interesting example is fast isomerization giving rise to an averaged fast-exchange peak. Thus a spectrum has only one peak that may be mistaken for two-site exchange. To explore this situation I set up simulation for the fast isomerization process with the same 3:1 ratio in favor of R* and micromolar binding with fast off-rate:
Simulate setup3a.txt U_R_Af_Bf
Report: summary_report
Location: Example_3/
Population graph is the same as in previous case because we did not alter any equilibrium constants:

However, the spectrum has only two peaks now:


Let's see what happens if we fit this data with the two-site model using LineShapeKin 3.2 (see fitting example in the U model analysis).
The result is rather remarkable: the line shapes in the three-site system (blue dots) cannot be accounted for by a two-state model (red line). The two-state model dictates faster decay of signal intensity in the first half of the titration (broader lines) and rapid gain of intensity at the end (narrower lines) as well as the exchange averaged peak positions are not matching the 3-site data.

Let's look at the chemical shifts and line widths more quantitatively.
First, we need to run a simulation for the 2-site model (U) using the parameters optimized in the fitting:

Quick conclusion: We observe a mismatch of the peak positions. The three-site model peaks shift more towards the bound state, the tendency which is seen specifically in the beginning and the end of the titration series. The shift seems minor on this graph but one needs to keep in mind that line widths here are on the order of 50-100 s-1 (graph below) so these shifts correspond to a significant line shape mismatch as is easily seen on the spectral graph (above).

The mismatch of the line width between 2- and 3-site model is significant. The 2-site peak tends to broaden quicker and to a larger extent before reaching a maximum at L/R about 0.4. Then the 2-site model peak narrows more rapidly than its 3-site model counterpart.
Both the mismatch of the line widths and the peak positions contribute to the failed fit of the 3-site data with the 2-site model. I propose that this kind of analysis may be done to suggest that a 3-site exchange model is required in specific experimental cases.
The reasons for this behavior is that the isomerization step presents a limit for overall exchange rate so despite increase in ligand concentration, the exchange regime does not accelerate past kex set by the rate of receptor isomerization so 3-site model peak fails to narrow as rapidly as dictated by the free ligand concentration increase.
One also should note, that the U_R spectra are possible to confuse with U_RL spectra as discussed in U_RL model description.
Here is another example where the spectra will only contain two peaks easy to confuse with 2-site exchange. To make the exchange regime slow I will use tight binding constant and slow off-rate for the binding transition. This the situation that if binding is slow we don't have much hope to discern the models.
# Association constants
Ka_names A B
Ka 1e7 3
# Rate constants of REVERSE reactions
k_names A B
k2 5 500
LRratio 1e-3 0.1 0.2 0.3 0.4 0.5 0.6 0.7 0.8 0.9 1.0 1.1 1.2
Issue Simulate setup U_R_As_Bf


Prepare line shape fitting in LineShapeKin_3
Result:

Fitting result is really good. Kd and Koff are very close to values of A transition. It means in slow exchange the contribution from isomerization of the receptor is small.
Let's alter distribution of the titration points so to group them closer to the equivalence point (so to better describe curvature on the population graphs):
LRratio 1e-3 0.2 0.4 0.6 0.7 0.8 0.9 0.95 0.98 1.0 1.02 1.1 1.2
Simulate setup3 U_R_As_Bf


Fitting of this data:

Fit is really good. It means if the binding has slow off-rate it will be difficult to detect presence of the receptor isomerization from NMR line shapes.
Appearance and evolution of the spectra if isomerization is slow have very remarkable features such as (1) moving peak of R and disappearing in-place peak of R*, which may serve as signatures of the model for the fast-exchange binding, and (2) three peaks observed in the beginning of titration for slow-exchange binding.
It is possible to detect presence of the receptor isomerization if both ligand binding and receptor conformational equilibrium are fast and only one peak present at any time during titration by performing line shape analysis.
It is unlikely that under experimental circumstances it will be possible to detect presence of the fast receptor isomerization if ligand binding is slow. The reverse titration of L with R is equally unable to detect isomerization coupled to slow binding with the only observation that binding affinity is scaled down by the equilibrium constant of formation of non-binding receptor species (see U_L analysis)
Back to LineShapeKin Simulation Tutorial